sábado, 30 de janeiro de 2010

Análise do DecisionPoint

More Correction Ahead
by Carl Swenlin
January 29, 2010

Last week's breakdown led me to believe that a medium-term correction was just beginning. So far this week that opinion has been reinforced by market action. For example, as of last Friday, short-term indicators were very oversold, and a technical bounce was to be expected; however, the market instead has drifted lower, causing me to assume that the oversold condition is being cleared by a decelerated decline rather than a reaction rally. This is bearish behavior, but there is no technical reason to believe that it is announcing a new bear market, only that bullish behavior will be in abeyance while prices work through the correction.

The weekly-based chart of the S&P 500 shows that the PMO is very overbought and has crossed down through its 10-EMA. It could take a few months to clear this condition by bringing the PMO back to the zero line.


Our intermediate-term indicators are no longer overbought, and they are low enough to support another price bottom; however, I would be happier to see them bottoming in the -150 area.

Bottom Line: I would like to see this correction continue for a few months. Keep in mind that corrections in bull markets do not have to be straight down affairs, rather there can be extended movement to the side and slightly down that serves the purpose of getting internals set for another advance without causing too much price damage.

The most obvious immediate support is around 1030, followed by a series of previous lows going down to 980, which would be the worst case if this correction is to remain in the "mild-to-moderate" category. If prices eventually drop to the area of the support at 870, that would be severe enough to start questioning our bull market thesis.

In the meantime, if prices continue lower, our timing models will start switching from buy to neutral. This could begin as soon as next week.

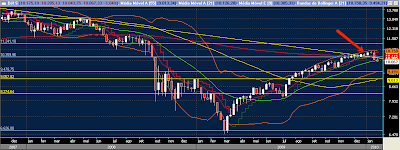
DJ e a MME200

Como comentado há alguns meses neste blog, o índice americano começa a sentir a força da MME200; resta saber até que momento se produzirá esse recuo.

sexta-feira, 29 de janeiro de 2010

IBOV em 2004

Alertas acionados


IBOV - comentário

Ibovespa fez ontem um novo candle de indefinição junto à BB inferior; ainda não há uma perspectiva de reinício de altas no índice, porém os indicadores de curto prazo mostram um esgotamento de força vendedora no diário; nada que não impeça maiores quedas (vide 2008); o rompimento da máxima de ontem injeta ânimo nos bulls; médias de curto prazo já demonstram inflexão de baixa.

... no semanal, observem que o índice está sendo sustentado pela MM21; estamos querendo fechar a 3a semana de baixa; o rompimento da máxima desta semana gera entrada de positions; MM9 já baixista, embora o mercado em si ainda seja de alta; a perda da MM21 pode aprofundar a queda na semana que vem; MACD linha mostra viés de baixa para o índice.


quarta-feira, 27 de janeiro de 2010

Vale, Eliott e e Fibo

Ursos podem estar cansados de tanta venda (em curto prazo); região interessante para um ST.

terça-feira, 26 de janeiro de 2010

IBOV

Interessante análise do trader Stormer, postado no site www.leandrostormer.com.br.

segunda-feira, 25 de janeiro de 2010

domingo, 24 de janeiro de 2010

Análise do DecisionPoint

Finally A Breakdown
by Carl Swenlin
January 22, 2010

The S&P 500 has finally decisively broken down through the support formed by the rising trend line that marks the bottom of the ascending wedge formation. This was the technical expectation, but the market sure did fight it. The break has also carried the price index through the 20- and 50-EMAs. I have drawn a dashed line from the November low, parallel with the upper boundary of the wedge to suggest a possible bottom of a rising trend channel. This line is not drawn by strict technical rules, just a bit of speculation on my part.

The first obvious support is at about 1030, not a real problem; however, the next obvious support is at about 870. That would be great in terms of a substantial correction, and it would raise fear levels to the point where a good buying opportunity might appear.

The weekly-based chart of the S&P 500 shows that the PMO has topped at a very overbought level, hinting that we may be at an important top. On the positive side, the price index is holding above the long-term declining tops line.

In the short term the market is very oversold, as illustrated by the Participation Index chart below. This could represent an initiation thrust for a decline that will last a lot longer, or it could mark the end of the decline altogether. The latter does not seem likely, but it would be consistent with the market action we have observed in recent months.


Bottom Line: We have just witnessed the worst three-day decline since the March 2009 bottom. I think it is the beginning of a more substantial decline, but short-term indicators are so oversold that the next thing we will probably see is a bounce. The most important thing to watch in the medium term is for 20-EMAs to cross down through 50-EMAs. In most cases, this will change buy signals to neutral signals, except where the 50-EMA is below the 200-EMA at the time of the 20/50-EMA crossover. That would be a sell. In the event that the S&P 500 bounces high enough to exceed the January highs, I would have to assume that the presently anticipated correction has run its course.

PFRM3

Essa é da série "pérolas esquecidas da Bovespa"; analisando o diário, vemos o seguinte:

1. formação semelhante a um cup and handle;
2. tendência de curto prazo lateral; médio prazo de alta;
3. estamos na 4a tentativa de rompimento de uma resistência;
4. preços lateralizados, próximos de MM21/55 e MM200 se aproximando; vejam como os preços tentam romper o Fibo, não conseguem, retornam à MM55 e sobem novamente (não é de se duvidar da repetição do mesmo movimento);

... agora os indicadores: IFR ascendente; OBV e AC/DC já com topos anteriores rompidos; MACD linha indicando compra...

... examinando mais detalhadamente o diário, vemos que esta mesma região foi uma resistência em setembro/2008; a diferença daquele momento para o atual é que a tendência presente é altista; antes foi pull back na MM55 (essa média parece ser bastante importante neste papel), agora, é acumulação para rompimento futuro;

... no semanal o gráfico é melhor ainda: observem uma concentração de candles junto ao Fibo, bastante próximos à MM21; atualmente é difícil se encontrar papéis que estejam próximos da MM21 pois o mercado subiu bastante e produziu distâncias consideráveis entre os preços e as MM21; observem a contração das BB indicando aumento futuro de volatilidade (ao eu ver, para cima...);

... indicadores no semanal: IFR lateral; OBV e AC/DC em altas expressivas (mostra que a pressão sobre os preços vai explodir, abrindo as bandas futuramente); MACD linha mostra um viés negativo para o papel, porém a média mais curta formadora do MACD já mostra novo cruzamento para compra;

... vejam o volume na época do pull back na MM55 diária (seta da esquerda) e o atual...

Como nada é perfeito, o papel tem problema de liquidez, mas, para quem quer um papel sem a volatilidade louca das blue chips (e dependência de fatores externos), acho uma boa alternativa.

sexta-feira, 22 de janeiro de 2010

quinta-feira, 21 de janeiro de 2010

IBOV

Depois da cunha rompida, vem o pull back.... depois do pull back, vem o OCO? (target = 61K)

Índice Futuro

Gringos saindo no IF.

TAMM4

quarta-feira, 20 de janeiro de 2010

TNLP4

Atenção ao teste de suporte.

EPH0 e MFI

CSMG3

Candle de reversão com volume...

segunda-feira, 18 de janeiro de 2010

Em um momento eles cansam...

Monitorar BRTO4 e CSMG3 para um contra-tendência.


domingo, 17 de janeiro de 2010

Petro - ADR

Analisando a Petro ADR, graficamente se observa um OCO sendo formado (e quase acionado)...; MFI do papel em estado sobrevendido; sempre que bateu neste patamar houve um repique considerável;

... aproximando esse OCO, graficamente é nítido, porém o volume nos deixa um tanto confusos (a mim, pelo menos); vejam que o volume não foi exuberante nas quedas, mas, pode-se concluir que foi maior; para quem tem esses papéis em carteira, atenção redobrada.

Oil - CLG0

Oil demonstrando violar suporte de Fibo, apesar dos topos e fundos ascendentes; observem que os topos no MFI (8) são levemente descendentes, o que gera uma divergência baixista com este indicador, o que se torna mais visível se usarmos o CCI. O viés no semanal é de baixa.


... ao analisarmos o diário, vemos que o MFI está no sobrevendido, tendo cruzado de maneira fulminante de cima para baixo, levando consigo os preços; desta maneira, mesmo sendo o semanal baixista, há possibilidade de em curtíssimo prazo o oil se valorizar, determinada pela inflexão do MFI; porém, como citado acima, o viés no semanal é baixista. Percebam que nesta região dos 75,00-78,00 há uma consolidação prévia, o qual pode agir como suporte aos preços. Concluindo: provável repique pelo diário, mas preponderância de queda pelo semanal.

Indicadores para amanhã

Lembrando que amanhã não teremos pregão nas bolsas americanas devido ao dia de Martin Luther King.

sábado, 16 de janeiro de 2010

EPH0 - análise

Analisando o índice futuro, temos uma idéia de como será o mercado a curto prazo; observem que o MFI no diário é baixista, bem como o CCI; ambos apontando para baixo, vindo de zona sobrecomprada; seus efeitos no índice já se fazem sentir...

... já a nível semanal, observamos uma clara indicação baixista entre o índice e o MFI; CCI no semanal permanece lateral e sobrecomprado; até então vínhamos em um mercado essencialmente bull, que por ora parece começar a querer ceder (pelo menos a curto prazo)...


... aqui se vê de forma mais clara a divergência baixista entre o MFI e o índice; o que pode explicar isso é o momento estritamente bull que vivemos; isso pode ser visto tb no gráfico diário, onde o MFI recuou e não trouxe o índice junto (entre novembro e dezembro/09); as desvantagens neste momento, e que sem dúvida vai se refletir por aqui, são: 1) os níveis de IFR agora são mais elevados que na lateralização anterior; 2) o índice brasileiro se encontra próximo ao TH; 3) o índice americano ronda a MME200, a qual ainda não se deu por vencida (falso rompimento);

... ainda sobre o MFI: no semanal ele está progressivamente aliviando, mas ainda tem potencial para maiores estragos, visto que o indicador no diário está "mandando" o índice recuar em concomitância; o recuo do MFI pode produzir uma queda das cotações o suficiente para produzir um momento de nova entrada para quem está esperando um bom momento para comprar; desta forma, com nova inflexão deste indicador para cima, teríamos a continuidade da tendência bull (mais a médio e longo prazos).

Dólar

Assim como o VIX, o dólar parece estar trabalhando dentro de um retângulo, com preços oscilando entre 1,73 e 1,79; esta variação pequena do preço se faz sentir na lateralização de médias (21 e 55) nas bandas sup/inf de Bollinger no diário.

... porém o OBV mostra uma movimentação mais vigorosa, com topo anterior já rompido, em uma divergência altista (entre o 1o e 2o topos)...

... MACD semanal em viés altista...

... no semanal, não fosse a mínima de mesmo valor da semana anterior, teríamos um engolfo de alta; vejam que o HiLo (4 períodos) tb demonstra a lateralização dos preços, tornando-se confuso; esse é o problema deste setup, quando o mercado fica com tendência lateral; MM21 aproximando-se dos preços, onde poderá exercer resistência, que por acaso é o topo do retângulo no diário. Observem que desde que os preços perderam a MM9, houve tentativas de rompimento desta média, sem sucesso; atualmente ela está mais lateralizada, construindo um novo fundo para o dólar a curto prazo.

Análise do DecisionPoint

Negative Divergences Abound
by Carl Swenlin
January 15, 2010

While the S&P 500 had managed to squeeze slightly above the ascending wedge that has contained the index for several months, this week it dropped back below the support and it is currently challenging the bottom of the wedge. The wedge has not resolved decisively in either direction, and it is possible that there will be no clear resolution. By that I mean the wedge is so narrow that the price index could continue to drift higher, lower, or sideways to where it will have exited the wedge without a clear resolution. If so, we will ignore the wedge and look for something else to provide some clarity.

I am still of the opinion that we will see some kind of downside correction because of the abundance of negative divergences to be found on our indicator charts. The first is the gradually contracting volume seen on the chart below.

The next chart shows the three indicators of our OBV (On-Balance Volume) suite with divergences clearly marked.


Finally, we have the new highs and new lows chart. Again, you can see the negative divergence over the contraction of new highs; however, this chart gives us reason to believe that the internal problems may not be too serious. Note that there have been virtually no new lows for many months, and, without an expansion of new lows, all the negative divergences we are seeing probably have no long-term significance. For example, note that the contraction of new highs at the end of 2007 was accompanied by a considerable expansion of new lows that gave warning of much greater than normal weakness.

Bottom Line: The abundance of negative divergences keeps waving the caution flag for a correction; however, the complete lack of new lows indicates that we are only witnessing cyclical weakness during an ongoing bull market, not a major top.

Gráfico do Elliottwave

One of the above charts dates back to a period during 1929-1930; the other shows a more recent picture. Can you tell the difference?

The data removed from these charts includes the labels, dates and prices (to which Financial Forecast subscribers are privy). That data shows the stunning correlation between the 2009 rally to date and the first bear-market rally of the Great Depression.

quinta-feira, 14 de janeiro de 2010