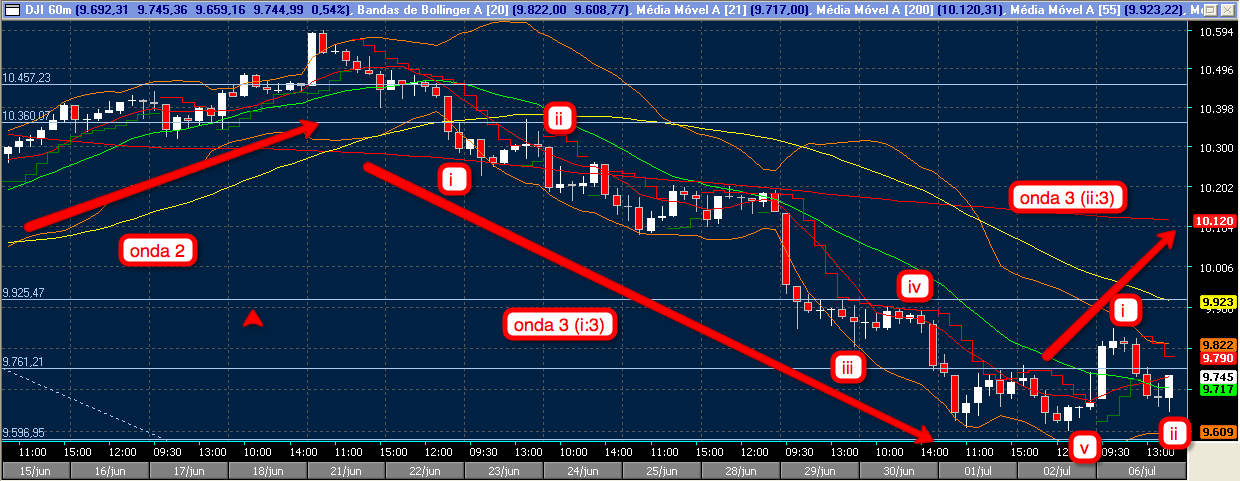
Interessante contagem por Elliott no IBOV postado no site www.andersonwilson.com.


One of the above charts dates back to a period during 1929-1930; the other shows a more recent picture. Can you tell the difference?
The data removed from these charts includes the labels, dates and prices (to which Financial Forecast subscribers are privy). That data shows the stunning correlation between the 2009 rally to date and the first bear-market rally of the Great Depression.

TRADERSCLASSROOM.COM by Alan R. Northam
http://www.tradersclassroom.com
2009 FORECAST ISSUE – The following forecast is how I see 2009 shaping up.
December, 2009 update
The overall trend in the stock market as measured by the NASDAQ remains in a bear market. However since March the NASDAQ has been correcting for its losses from the October 2007 high. This corrective rally, in Elliott wave terminology, is called corrective wave 2 circle. Wave 2 circle market corrections are typically deep retracements. I have therefore shown the wave 2 circle corrective wave to end at the 61.8% Fibonacci retracement level. However keep in mind that the only requirement is that wave 2 Circle cannot retrace more than 100% of wave 1 circle.
As can be seen by the chart the NASDAQ continues to slowly roll over as it transitions from an upward trend to a downward trend. Notice also that the NASDAQ remains just below our target price level of 3351.84 which represents the 61.8% retracement level of wave 1 circle down.
Looking at OBV notice that it peaked in September much closer to our forecast- ed price peak.
I will be doing a year end wrap up for the 2009 Forecast Issue which will complete this series of forecast for how I see 2009 shaping up and will be unvailing my 2010 Forecast on January 1st.


 Postagens
Comentários
Postagens
Comentários