segunda-feira, 30 de novembro de 2009
domingo, 29 de novembro de 2009
sexta-feira, 27 de novembro de 2009
Fractais no SP500?
2.jpg)
quinta-feira, 26 de novembro de 2009
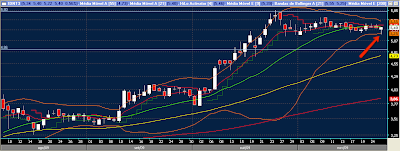
IDNT3 (atualização)
DAX
VIX diário
Cunhas
Ficar de olho para as seguintes possíveis cunhas em formação. Cunha baixista na Vale, podendo chegar nos 37,00 em uma correção de 15-20% nos preços (a cunha baixista é inclinada para cima).

Quem é longo prazo claro que não muda muita coisa. Pode-se aproveitar e lançar ITM e montar uma trava de baixa agora para proteger um pouco a posição, já que se houver uma queda, não deve ser maior do que uns 15-20% do valor atual, levando aos 37. Ou então fazer uma venda parcial da posição para montar um caixa e aproveitar se ela corrigir, já que é menos provável que ela continue com este momentum para cima.
CUNHA ALTISTA (inclinada para baixo)
BRKM5
Vejam que ela já fez o mesmo padrão antes:
Do ponto de vista operacional:
quarta-feira, 25 de novembro de 2009
Euro

DJ a longo prazo
terça-feira, 24 de novembro de 2009
Dica de site
Dica de site com diversos softwares bastante úteis no campo em que atuamos, como por exemplo, nas especialidades abaixo:
- Data Analysis
- Forecasting & Econometrics
- Graphing & Countouring
- Mathematics
- Risk Management
- Simulation & Optimisation
- Statistics
Permite download de versões demo, e aceita VISA!
Mais da MM200 no DJ

IBOV
IDNT3

ELET6

segunda-feira, 23 de novembro de 2009
DJ 60min

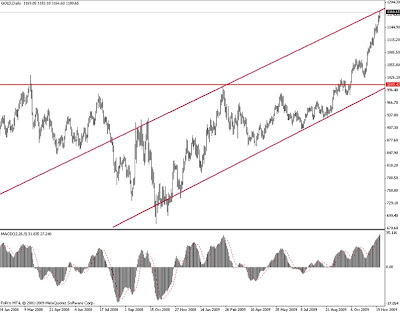
A incrível trajetória do ouro

domingo, 22 de novembro de 2009
Análise do DecisionPoint
NOTE: I will be taking next week off, and there will be no Chart Spotlight article posted. Have a Happy Thanksgiving!
Stocks have been in the overvalued end of the normal P/E range since the early-1990s, and this condition shows no sign of abating. Below is an excerpt from our daily earnings summary that will offer readers a better perspective. I have outlined the 2009 Q4 results because that is the first quarter not distorted by the huge loss reported in 2008 Q4. While the results of the current quarter are not final, 90% of companies have reported, and I don't think there will be any surprises from the remaining companies sufficient to change the estimated results a substantial amount. As you can see, valuations are projected to be well above the overvalued limit of the range (P/E of 20) through the first two quarters of 2010. If the market continues to rally, the over valuation will persist into the foreseeable future.

Since price movement over the last two decades seems to have little relationship to P/E ratios, why pay any attention to values? In fact, Decision Point's trend-following models consider price movement and nothing else. Nevertheless, we still want to be aware of the condition of the fundamental foundation of the market, and we believe that investor ignorance in this regard will only lead to more pain. After all, investors have been ignoring valuations for nearly two decades, and the result has been a stock bubble and two major bear markets. Most have not fared well during this period.
At each price top for the last two months I have been expecting a correction to begin, yet price declines have been relatively small and each top is followed by a higher top. Frustrating! I am not trying to identify a shorting opportunity, because shorting is not recommended during a bull market. The only reason that a decent correction is important is that it will provide a lower-risk opportunity to open new long positions.
For two weeks the market has been rolling over into what could be another short-term top. Or it could be the beginning of the long-awaited correction. Negative divergences still abound, but, as I told a subscriber, these conditions are usually not too serious in a bull market. The market is vulnerable, but it is not a time for shorting. We could reasonably expect the rising wedge pattern to break down, but you can see that there is support just below the wedge.

sábado, 21 de novembro de 2009
DJ Transportation

A importância da MM200 exponencial no DJ em 30 anos


.jpg)


